Epidemic, Radioactive Cloud And Social Distancing
The purpose of this post (a little unusual) is to illustrate in a simple way the incredible potential effectiveness of social distancing measures (limiting meetings, hygiene, telecommuting, closing schools …) when faced with an epidemic that turns into a pandemic.
An epidemic is a chain reaction, and that changes everything about the potential impact of such measures, compared to other sources of danger.
To understand this well, imagine another situation: suppose that we are not facing an epidemic, but a danger of another type, say a radioactive (or chemical) cloud. Because of the presence of the cloud, imagine that it becomes risky to go out, that it could make us sick, or even eventually kill us. (And suppose that locked up at home we fear nothing).
The government decides to take measures to confine people to their homes: close certain schools, encourage teleworking, invite people to postpone their trips, meetings, etc.
In this case, we can legitimately imagine that the lives saved will be proportional to the intensity of the efforts:
- If 10% of people stay at home, 10% of deaths will be avoided;
- If 50% of people stay at home, 50% of deaths will be avoided;
- If 95% of people stay at home, 95% of deaths will be avoided.
The effect is linear.
An epidemic is not that at all. An epidemic is a chain reaction, this implies that there is a threshold effect on the effectiveness of the measures, and this threshold effect is very strongly non-linear.
Even when one is familiar with associated mathematics, it is quite difficult to imagine this threshold effect, so let’s take a concrete example from an epidemiological model.
The model I’m going to use is called the SIR model. It is one of the simplest models, and the use I am going to make of it is not predictive. I am not trying to really predict the number of dead or infected: The model is too simple, the parameters will be too imprecise.
I am going to make educational use of it, to illustrate this notion of the threshold, and how social distancing measures can have an incredibly effective effect, not at all proportional to the effort as in the case of the radioactive cloud.
In this model, we consider that we have 3 populations: healthy, infected, and remitted (those who have had the virus and have recovered). And we will model two simple phenomena:
- Infected people will infect healthy people.
- Infected people will gradually heal.
For this, we need 3 parameters:
- The duration D of the disease, during which one is contagious.
- The average number C of contacts we have with other people every day.
- The probability P that contact between an infected and a healthy person will lead to a transmission of the virus.
Very often, we do not know precisely these parameters, which will depend on the precise definition of what is called “a contact”. But you will see that it is not very important.
Take an infected person: each day he will meet C people, whom he will contaminate with a probability P. And this will happen during each of the D days that his illness lasts.
The total number of people it will contaminate will, therefore, be the product of these three terms, which we traditionally noteR0
R0 = C * P * D
This parameter is called the reproduction rate, and even without running the mathematical model, it is not very complicated to convince oneself that it has a determining influence on the fate of the epidemic.
If it is worth saying 2: each infected person will contaminate 2 people, who will contaminate 2 people themselves, who will contaminate 2 people etc. We have a chain reaction, the number of patients increases exponentially, the epidemic explodes.
Now if this coefficient is less than 1: each infected person will pass the disease on to less than one person, so the net number of patients will decrease and the epidemic will gradually go away.
There is a monstrous threshold effect. To extinguish an epidemic in a “natural” way, the R0 must be below the fateful threshold of 1. So how much is the R0 in the case of Covid-19? We don’t know exactly. Probably between 2 and 4.
But as you can see, this value is not intrinsic to the disease, it depends on behavioral factors: how many daily contacts, what probability of transmission.
By adopting measures of social distancing (fewer contacts, staying further, hygiene, suppressing unnecessary gatherings and meetings, the closing of schools, telecommuting, etc.), one can very easily lower the R0.
And the key point here is that the benefit will not be at all proportional to the effort. If we do enough to pass quickly below the threshold, it is won.
Imagine that the R0 is initially 2.5. This is a reasonable assumption for the Covid-19. If we manage to divide it by 4 we very quickly block the spread of the epidemic.
Dividing the R0 by 4 is far from inaccessible: this can mean, for example, having 2 times less contact, and ensuring that the probability of transmission is divided by 2 (by a greater distance and special attention to the ‘hygiene.)
To illustrate this point, I amused myself by putting a SIR type model in Excel taking as a starting point the approximate situation in France on 03/11/2020.
Again, the goal is not to make predictions, it is that you can see for yourself, through “digital” experimentation, that this threshold effect of R0 is monstrous. This is, therefore, a “toy model”.
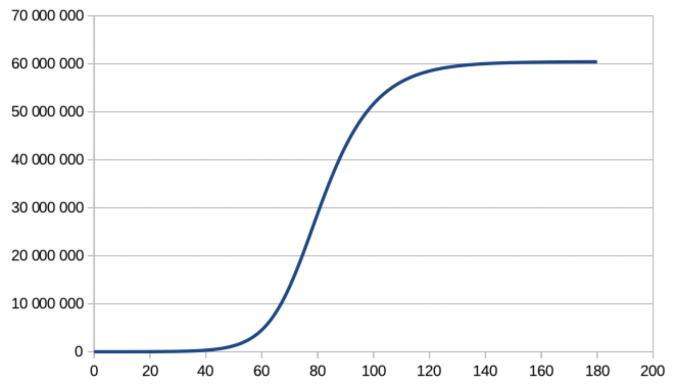
Take an R0 of 2.5. It can be obtained by saying that the disease lasts 10 days and that each day we have 50 contacts with a probability of transmission of 0.5%. These last two figures are not important, it is the product of the two that counts.
The graph below represents the cumulative number of cases as a function of time (in days from today) in France if we stay at an R0 of 2.5. (It is not a prediction, it is a “toy model”!)

We see that in 6 months, almost everyone will have caught the disease. With a mortality rate of 3%, we are almost 2 million dead (It is not a prediction, it is a “toy model”!)
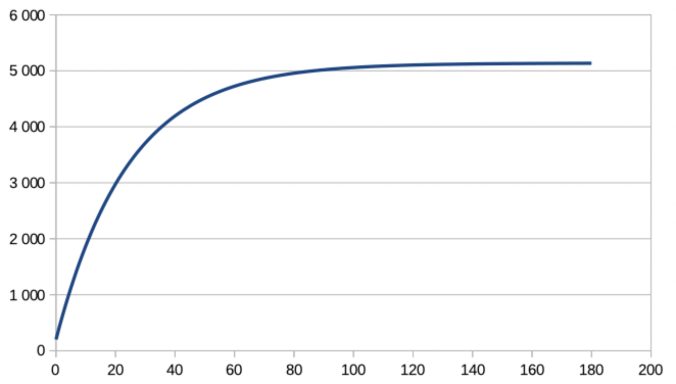
Now imagine that we can immediately divide the R0 by 4: half the number of contacts, and more distant contacts which divide the probability of transmission by 2. It doesn’t seem unreachable, right? The R0 will then be 0.62. Here’s the result

We are capped at 6000 cumulative cases, and therefore 180 deaths with a mortality rate of 3% (This is not a prediction, it is a “toy model”!)
A monstrous, enormous difference. Totally disproportionate to the initial change we made (“simple” halving of contacts and transmissions).
An epidemic is a chain reaction. Social distancing measures can have a completely disproportionate effect. This is very very very different from the case of the radioactive cloud, where containment measures would have an essentially linear effect.
And this is obviously linked to the fact that in the case of the cloud, by being careful you only protect yourself. Here we protect everyone.
That’s all I wanted to illustrate. Take the Excel template, play with it. It is only a model, the simplest of all in epidemiology. It has NO predictive value on the details of the figures. He is there to illustrate the principle of chain reaction, which is at the heart of the concept of the epidemic. The details of the model are not important, this chain reaction effect exists in all models.
Reducing the R0 quickly is very accessible, without necessarily falling into a “dead country” or “martial law” situation. I think that closing schools and educational institutions could create the necessary signal for everyone to take action. And in a few weeks, it would be folded.
Download the toy model. Play with it. See for yourself.
A lot of people have made small apps that illustrate the model interactively:
https://jflorian.shinyapps.io/SIRmodel/
https://sciencetonnante-epidemie.netlify.com
https://epidemic.phoenix-it-services.com