Epidemic, Radioactive Cloud And Social Distancing

The purpose of this post (a little unusual) is to illustrate in a simple way the incredible potential effectiveness of social distancing measures (limiting meetings, hygiene, telecommuting, closing schools …) when faced with an epidemic that turns into a pandemic.

An epidemic is a chain reaction, and that changes everything about the potential impact of such measures, compared to other sources of danger.

To understand this well, imagine another situation: suppose that we are not facing an epidemic, but a danger of another type, say a radioactive (or chemical) cloud. Because of the presence of the cloud, imagine that it becomes risky to go out, that it could make us sick, or even eventually kill us. (And suppose that locked up at home we fear nothing).

The government decides to take measures to confine people to their homes: close certain schools, encourage teleworking, invite people to postpone their trips, meetings, etc.

In this case, we can legitimately imagine that the lives saved will be proportional to the intensity of the efforts:

  • If 10% of people stay at home, 10% of deaths will be avoided;
  • If 50% of people stay at home, 50% of deaths will be avoided;
  • If 95% of people stay at home, 95% of deaths will be avoided.

The effect is linear.

An epidemic is not that at all. An epidemic is a chain reaction, this implies that there is a threshold effect on the effectiveness of the measures, and this threshold effect is very strongly non-linear.

Even when one is familiar with associated mathematics, it is quite difficult to imagine this threshold effect, so let’s take a concrete example from an epidemiological model.

The model I’m going to use is called the SIR model. It is one of the simplest models, and the use I am going to make of it is not predictive. I am not trying to really predict the number of dead or infected: The model is too simple, the parameters will be too imprecise.

I am going to make educational use of it, to illustrate this notion of the threshold, and how social distancing measures can have an incredibly effective effect, not at all proportional to the effort as in the case of the radioactive cloud.

In this model, we consider that we have 3 populations: healthy, infected, and remitted (those who have had the virus and have recovered). And we will model two simple phenomena:

  • Infected people will infect healthy people.
  • Infected people will gradually heal.

For this, we need 3 parameters:

  • The duration D of the disease, during which one is contagious.
  • The average number C of contacts we have with other people every day.
  • The probability P that contact between an infected and a healthy person will lead to a transmission of the virus.

Very often, we do not know precisely these parameters, which will depend on the precise definition of what is called “a contact”. But you will see that it is not very important.

Take an infected person: each day he will meet C people, whom he will contaminate with a probability P. And this will happen during each of the D days that his illness lasts.

The total number of people it will contaminate will, therefore, be the product of these three terms, which we traditionally noteR0

R0 = C * P * D

This parameter is called the reproduction rate, and even without running the mathematical model, it is not very complicated to convince oneself that it has a determining influence on the fate of the epidemic.

If it is worth saying 2: each infected person will contaminate 2 people, who will contaminate 2 people themselves, who will contaminate 2 people etc. We have a chain reaction, the number of patients increases exponentially, the epidemic explodes.

Now if this coefficient is less than 1: each infected person will pass the disease on to less than one person, so the net number of patients will decrease and the epidemic will gradually go away.

There is a monstrous threshold effect. To extinguish an epidemic in a “natural” way, the R0 must be below the fateful threshold of 1. So how much is the R0 in the case of Covid-19? We don’t know exactly. Probably between 2 and 4.

But as you can see, this value is not intrinsic to the disease, it depends on behavioral factors: how many daily contacts, what probability of transmission.

By adopting measures of social distancing (fewer contacts, staying further, hygiene, suppressing unnecessary gatherings and meetings, the closing of schools, telecommuting, etc.), one can very easily lower the R0.

And the key point here is that the benefit will not be at all proportional to the effort. If we do enough to pass quickly below the threshold, it is won.

Imagine that the R0 is initially 2.5. This is a reasonable assumption for the Covid-19. If we manage to divide it by 4 we very quickly block the spread of the epidemic.

Dividing the R0 by 4 is far from inaccessible: this can mean, for example, having 2 times less contact, and ensuring that the probability of transmission is divided by 2 (by a greater distance and special attention to the ‘hygiene.)

To illustrate this point, I amused myself by putting a SIR type model in Excel taking as a starting point the approximate situation in France on 03/11/2020.

Again, the goal is not to make predictions, it is that you can see for yourself, through “digital” experimentation, that this threshold effect of R0 is monstrous. This is, therefore, a “toy model”.

Take an R0 of 2.5. It can be obtained by saying that the disease lasts 10 days and that each day we have 50 contacts with a probability of transmission of 0.5%. These last two figures are not important, it is the product of the two that counts.

The graph below represents the cumulative number of cases as a function of time (in days from today) in France if we stay at an R0 of 2.5. (It is not a prediction, it is a “toy model”!)
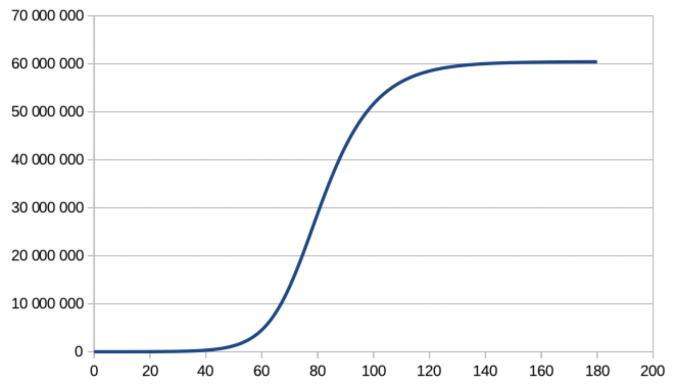
We see that in 6 months, almost everyone will have caught the disease. With a mortality rate of 3%, we are almost 2 million dead (It is not a prediction, it is a “toy model”!)

Now imagine that we can immediately divide the R0 by 4: half the number of contacts, and more distant contacts which divide the probability of transmission by 2. It doesn’t seem unreachable, right? The R0 will then be 0.62. Here’s the result
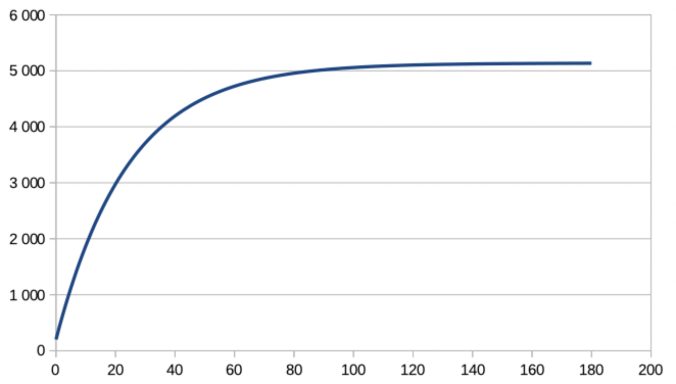
We are capped at 6000 cumulative cases, and therefore 180 deaths with a mortality rate of 3% (This is not a prediction, it is a “toy model”!)

A monstrous, enormous difference. Totally disproportionate to the initial change we made (“simple” halving of contacts and transmissions).

An epidemic is a chain reaction. Social distancing measures can have a completely disproportionate effect. This is very very very different from the case of the radioactive cloud, where containment measures would have an essentially linear effect.

And this is obviously linked to the fact that in the case of the cloud, by being careful you only protect yourself. Here we protect everyone.

That’s all I wanted to illustrate. Take the Excel template, play with it. It is only a model, the simplest of all in epidemiology. It has NO predictive value on the details of the figures. He is there to illustrate the principle of chain reaction, which is at the heart of the concept of the epidemic. The details of the model are not important, this chain reaction effect exists in all models.

Reducing the R0 quickly is very accessible, without necessarily falling into a “dead country” or “martial law” situation. I think that closing schools and educational institutions could create the necessary signal for everyone to take action. And in a few weeks, it would be folded.

Download the toy model. Play with it. See for yourself.

A lot of people have made small apps that illustrate the model interactively:

https://jflorian.shinyapps.io/SIRmodel/

https://sciencetonnante-epidemie.netlify.com

https://epidemic.phoenix-it-services.com


Program Your Micro: Bit Anywhere With Your Smartphone

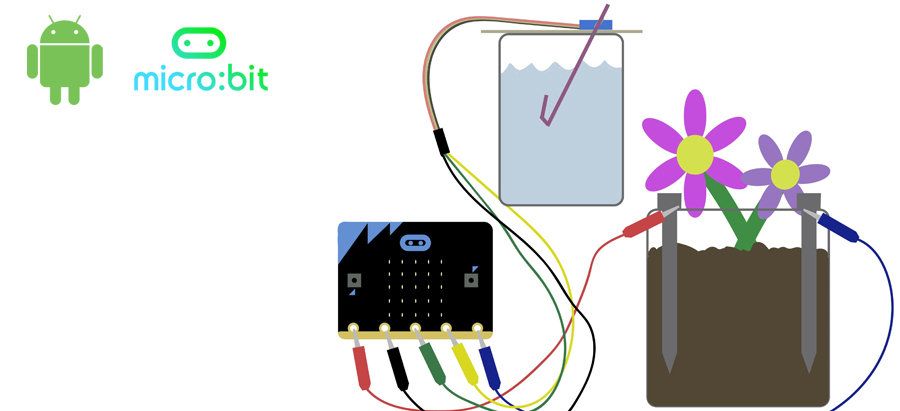
Did you know that it is possible to program the micro: bit card with a smartphone? For those who do not know micro: bit, this is a single-board computer (like Raspberry Pi or Arduino) launched by the BBC in 2015. Since then, this nano-computer the size of half a credit card has conquered the world of education in England, but also in the rest of Europe!

Micro: bit is very inexpensive (€ 16.90 incl. Tax), even compared to an Arduino or Raspberry Pi

Micro: bit contains a lot of components:

  • 2 microcontrollers
  • 1 Bluetooth chip
  • 1 digital compass
  • 1 accelerometer / gyroscope
  • 1 temperature sensor
  • 1 micro-USB port
  • 1 battery connector
  • 2 programmable buttons A and B
  • 1 matrix 5 x 5 of 25 individually programmable red LEDs
  • 5 input-output rings (analog / digital)
  • 20 connection pins (GPIO ports)

Micro: bit is very small (the size of a half-credit card for less than 2mm thick – 6mm, if we include the buttons A and B)

Many compatible accessories have been developed by other manufacturers such as Seeed Studio, Elecfreaks or Kitronic. Micro: bit is even compatible with the Raspberry Pi camera module!

There is a large micro: bit community, and many online resources that allow you to get started very quickly (guides, tutorials, projects)

Programming a micro: bit card is done from a computer, but also from a smartphone or tablet. Our little guide explains this in detail!

Step 1: Download The Micro: Bit Application On Your Device (Smartphone Or Tablet)

The micro: bit application exists for Android and iOS:

  • Micro: bit app for Android
  • Micro: bit app for iOS

Step 2: Pair The Micro: Bit Card With The Application

The micro: bit card must be supplied (3.3V with batteries, 5V via a USB cable). The LED array will light up if the card is powered properly.

Bluetooth must be activated on your smartphone or tablet.

  • Turn Bluetooth on or off on an Android device
  • Turn Bluetooth on or off on an iOS device
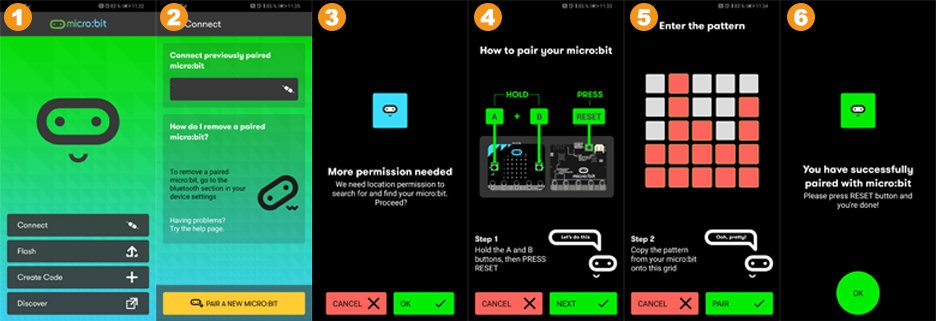
  1. Open the micro: bit application and press the “Connect” button
  2. Press the “Pair a new micro: bit” button
  3. The application may request permission to access certain features of your phone.
  4. To perform pairing, keep the A and B buttons pressed, and simultaneously press the Reset button (about 2-3 seconds), before releasing it. Then release the buttons A and B.
  5. A diagram is then drawn on the LED matrix of the micro: bit card, which must be traced identically on the application.
  6. To finish the pairing procedure, press the Reset button.

The application names your new card, ours is called VAGOP:

Step 3: Create A Program

As we said above, there are many online resources for micro: bit and it will be very easy to find the first project that you will like to start!

One of the easiest ways to quickly see if your pairing is working is to test the temperature sensor.

To create a micro: bit program on Android, nothing could be simpler! On the main application interface, select “Create code”, this opens the micro: bit website web page from where you can choose the programming language in which you want to code.

Choose between the MakeCode visual editor or the Python editor and enter the code above (you can change the language of the editor by clicking on the “Parameters” icon symbolized by the toothed wheel.

Tap the purple icon at the bottom right of the screen to download the code .hex file to your device.

Step 4: Upload A Program To The Micro: Bit Card

Return to the main interface of the micro: bit application and select “Flash”.

Here you find the list of the micro: bit programs (files in .hex format) saved in your device. Select the program that interests you and press the “Flash” button. The program then uploads to your micro: bit card.

A message will tell you that the upload procedure has worked correctly. If you want to upload a new program to your micro: bit card, you will need to pair it again. As your card has already been paired once, it will be much simpler, you just need to press the name of your card on the main interface.

5 Errors Of Beginners In Welding

Are You Making These Mistakes?

Don’t worry, I made all of these mistakes myself. And sometimes it still works. But by correctly learning the welding technique, you reduce the chances of operating errors in your circuit, due to bad welding.

Note: in French, there is confusion and amalgamation between welding and brazing. In electronic wiring, it will always be the soldering process even if the term soldering is used.

1: Removing The Iron Before Applying The Solder

When I teach someone how to weld, I usually say that you have to heat the spindle and the pad first and then apply the solder.

But sometimes my explanation is not clear enough. I have seen students heat the pad and pin, then remove the soldering iron before trying to apply the solder.

Unfortunately, this cannot work well. When you remove the iron, the pad and the pin cool down quickly; the solder cannot melt.

2: Heat Only The Tablet

Another common mistake is to only heat the pellet. The person heats the patch, then applies the solder. But since the component spindle has not been heated, the welding does not take place with the spindle.

You will have the same connection fault if you only heat the component’s tab. You will get a drop of solder which will “float” above the patch.

3: Cut The Component Leg Too Short

To have a circuit that looks clean and pleasant to look at, I have seen students push the components as far as possible into the holes, then cut the tab so that it does not protrude from the board.

This makes it difficult to weld the spindle. The cabler then ends up with a solder covering the hole but, which is not actually connected to the pin.

4: Use Of Too Little Solder

Some beginners are afraid to use too much solder, so they deposit too little. The amount of solder is not necessarily the most important point, but it is generally preferable to apply a good dose of solder from the start.

You will thus obtain complete soldering which will ensure a correct connection of the assembly.

5: Fear Of Overheating The Assembly

The circuit can support more than it seems. I have seen students worried about overheating the circuit. They, therefore, try to solder the assembly in less than a second to keep the card out of possible overheating. Today we use lead-free solder (tin, silver, copper) and the melting temperature is 217 degrees Celcius.

It is certain that you can damage the components if you heat them too long, but that’s not the thing to worry about at first.

It is, therefore, necessary to heat the component chip assembly correctly (with a fault at 350 ° C).

Two Popular Credit Cards

One million Arduino cards and clones have been sold every year since 2013 and more than 65 million blue CB cards are in circulation.
All blue cards.
Which do you use most often?

Credit Card CB

The CB blue card is a French invention born in 1967 to develop the use of the bank card to pay in any store.

In 1964 Roland Moreno invented the memory card or smart card.

It was in 1986 that we saw the appearance of the first bank chip card resulting from the combination of the two inventions.

Arduino Board

In 2002, Massimo Banzi started teaching computer science for physical systems. He teaches his students how to use and program an electronic card to create “prototypes of interactive objects”. The electronic cards used and available at the time were difficult to use in the context of learning (cards for industrial use, Windows, size, cost, etc.).

Massimo, therefore, imagines a complete and tailor-made solution called Programma: a development environment, a simple programming language, an electronic card that you can make and wire yourself and tutorials.

We can well imagine the enthusiasm and satisfaction of the students to work with this unified, simplified and efficient environment.

But Massimo wants to go further in his approach. He wants to transform the success of Programma into something universal and accessible to a large audience.

Massimo BANZI 

In 2005, with four other designers or computer scientists like him, he created Arduino. It is a printed circuit equipped with a small microcontroller, a serial link and especially small holes allowing the connection of sensors (temperature, humidity, light, sound, vibration, push-button) and actuators ( LED diodes, motors, displays…).
The core of the Arduino project development team is made up of Massimo Banzi (Italy), David Cuartuelles (Spain), Tom Igoe (United States), Gianluca Martino (Italy), David Mellis (United States) and Nicholas Zambetti (Italy).

From left to right: David Mellis, David Cuartuelles, GIanluca Martino, Massimo Banzi,

Arduino is “Open Source”. This means that you can download the original diagram and use it to make your own map and sell it without paying copyright. “Open Source” has made it possible to rapidly diffuse the Arduino concept around the world to generate a very large community that is constantly improving the cards.

In 2017, there were approximately three million units sold, not counting counterfeits or legal copies.
The number of users greatly exceeds this because anyone can make their Arduino board. The only Chinese copies distributed are estimated at three or four million copies.

The Polyphonic Music Revolution

Until about 1930, only mechanical processes could be used to produce sounds (percussion, string or wind instruments). The invention of the triode in 1906 (vacuum tube with three electrodes) allowed the development of all kinds of electronic devices. We knew how to artificially create music by using alternating currents, that is to say, electronic oscillations, generated either mechanically (alternators with musical frequency), or also by tube oscillators, or even by cells photoelectric acting on a loudspeaker “motor”.

Small Historical Summary

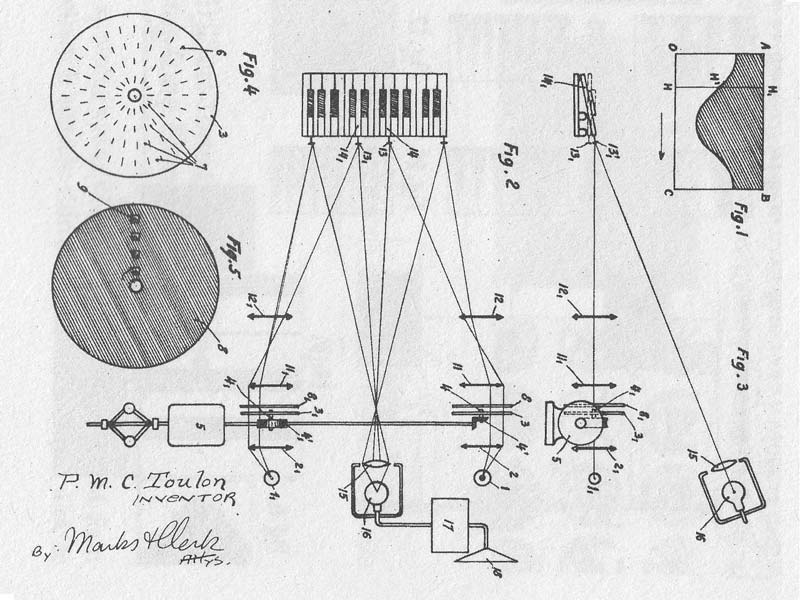
In 1927 Pierre TOULON and Krugg BASS invented the Cellulophone, an electric musical instrument that uses a photoelectric sound generator with an optical disc (celluloid disc pierced with slots).

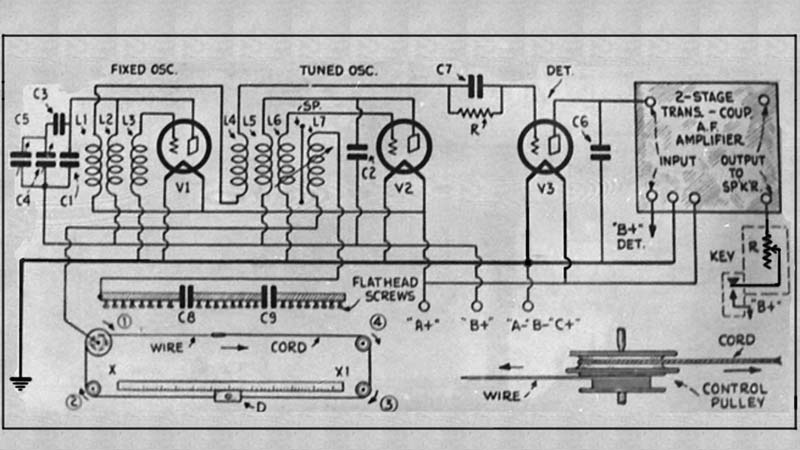
In 1928 the patent for the first model “Ondes-Martenot” was registered (lamp oscillator).

In 1929, with 700 tube oscillators, for 70 notes and 10 timbres, two French engineers Armand GIVELET and Edouard Eloi COUPLEUX developed an electronic organ using more than 1000 tubes. It is the first fully polyphonic instrument.

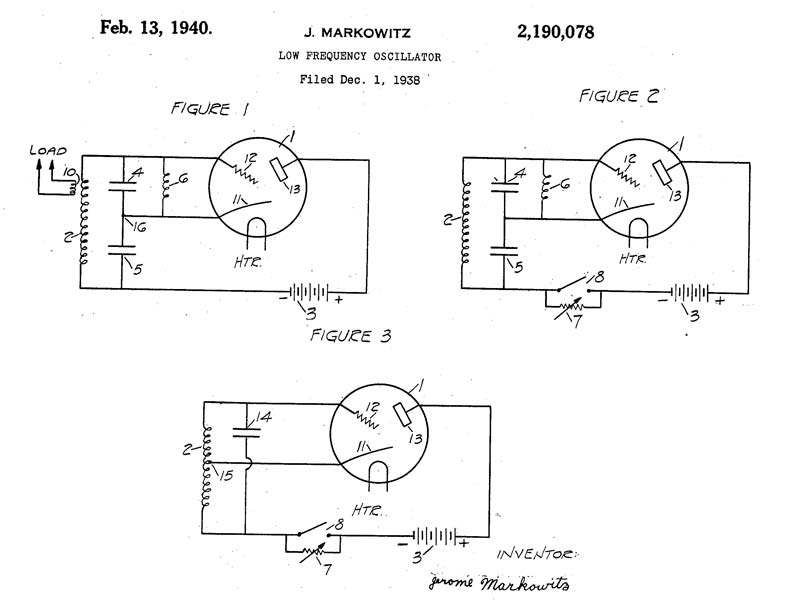
In 1938 Jerome MARKOWITZ files the first patent (US Patent) for the stable oscillator.

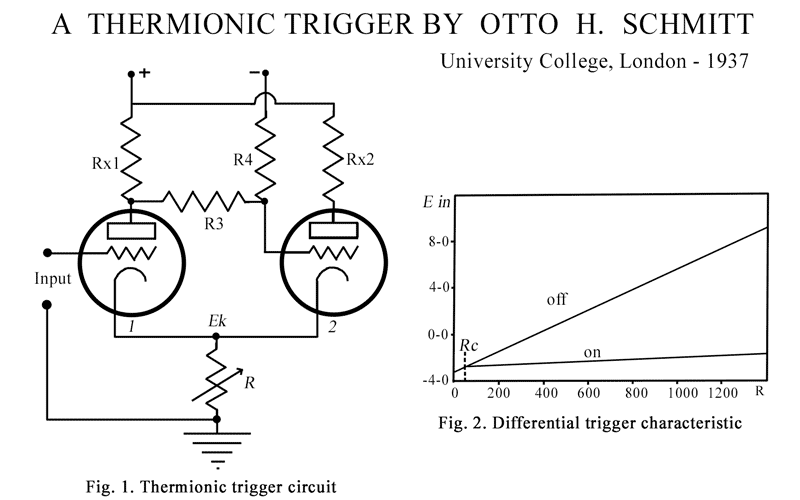
The Schmitt trigger invented by Otto H. SCHMITT was then the most widespread generator because it was quite easy to make.

Diagram of the thermion trigger of Otto H. SCHMITT

The simple two-triode circuit that is described provides positive stop control with any desired differential from 0.1 volts to 20 volts. Less than 10 -6  A is required at the input, but up to 20 mA at 200 V is available at the output. The output can be taken on either triode; one is on while the other is off. Positive or negative control is possible. The operating cycle takes approximately 10 µs.

New Synthetic Organs

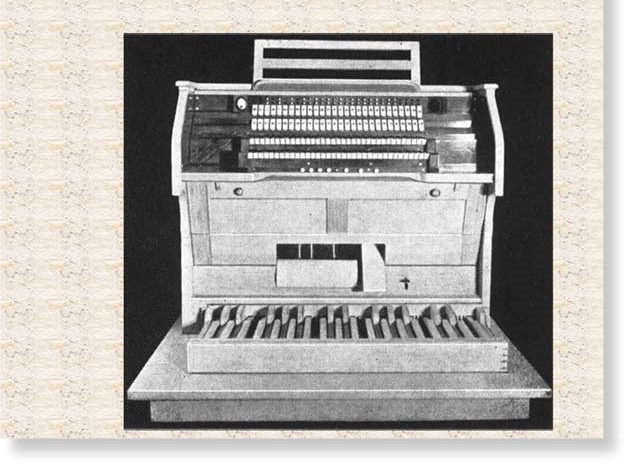
From 1935 two very sophisticated instruments enriched the range of organs intended to replace the bulky and expensive sound titans, which boast the galleries of cathedrals. These two remarkable newcomers are the Welte photoelectric organ made in Germany and the Hammond electromagnetic organ built in the United States.

The Hammond electromagnetic organ, in particular, is able to perform at the discretion of the performer a practically unlimited number of combinations of timbres, thus allowing the musician to really “create” the sounds suggested by his musical inspiration and not only combine the few fixed timbres of the classical orchestra.
It was, for the time, a whole revolution in the field of polyphonic music that already announced the constant progress of sound synthesis by purely electric processes, thus achieving a “symbiosis” of science and art.

“WELTE” Organ

The Welte-Lichtton-Orgel, designed by Edwin WELTE in Germany between 1932 and 1935, was one of the ancestors of the electronic organ, operating using optoelectronic sound generators.

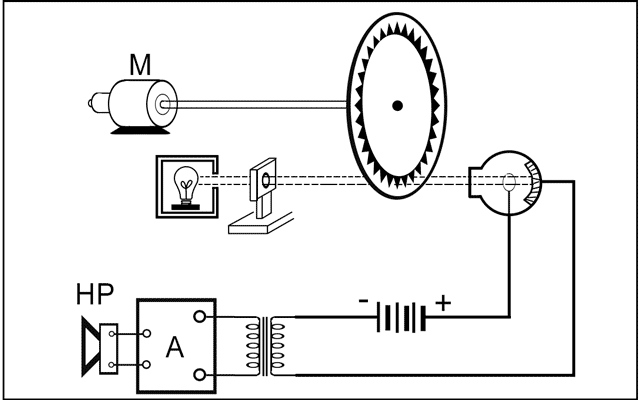
The operating principle consists of spinning, at a constant speed, glass discs printed in the manner of the optical soundtracks of the first talking cinema.

These glass trays are printed with 18 different waveforms giving three different timbres for all the octaves of each note.

A sensor consisting of a photoelectric cell is placed in front of each track and captures the variations in light from a light source located on the other side of the disc. The variations are then amplified and reproduced on a loudspeaker.

“HAMMOND” Organ

The Hammond organ works by electromagnetism.

The generators making up this organ are also extremely simple. They are toothed wheels rotating in front of sensors made up of coils with soft iron cores equipped with a magnet. An axis driven by a synchronous motor carries cogwheels from 2 to 192 teeth.

When passing in front of the sensor, the teeth of a wheel cause the latter to change its magnetic state. This modification induces an alternating current in the coil, the frequency of which is determined by the number of teeth passing per second in front of the end of the magnetic core.

Retrospective

Pure Synthetic Music

It is remarkable that each progress in instrumental technique was followed almost immediately by a broadening of the musical inspiration of the composers. Thanks to sound synthesis, it becomes possible for inspiration to manifest itself at the cost of certain learning.

In fact, since we know how to record all known stamps on film, then reproduce them thanks to the photoelectric cell, nothing stands in the way of photographic recording, we replace in the sound player a strip created from scratch and the only thanks to our inspiration. This is what the German physicist Pfaenninger did, by drawing curves on a strip and then scrolling through this strip in an appropriate reader.

A second synthesis process was studied, in particular by the Italians Gennelli and Pastori. It is an electrical reconstruction of the human voice always by the process of dosing harmonics.
In this process, the generator is no longer followed by more than five filters corresponding to the fundamental emitted and to four higher harmonics. The generator is of the tube type, which makes it possible to vary the fundamental frequency.
This process only authorizes the creation of vowels, which can be produced with absolute purity.

Octave Transposition

When it comes to reproduced music, film or disc, it is possible, starting from the music performed by classical instruments, to create new timbres, more perfect than real timbres, also more pleasant, by the process of artificial transposition.

It was a Russian, Mr. Yankowski, who first had the idea of ​​this transposition.
He had noticed that, in certain instruments, the timbre, particularly rich in a certain range, became nondescript, even unpleasant in others.

It is undeniable, for example, that the treble of the piano is infinitely drier than the medium or the bass.
On the other hand, the lightness of the violin on the chanterelle does not persist on the other strings.

By means of the recording, it becomes possible to transpose from one octave to the other a passage executed in the most pleasant range of an instrument. Suppose we wanted to get the 5 of the piano, already high, less pleasant than the 3 of 435 periods: we record the passage taking the octave of the 3 as a base, but, on reproduction, we will play the recording to the player four times faster than it was recorded. If on the recording, the movement has been slowed down four times, it will be found normal during reproduction, but the notes, rich in timbre, of the 3 will become the 5 sought.

In this way, there is much to seek and realize, because the artistic possibilities thus offered, to inspiration are considerable by combining the processes of sound synthesis.

Keyboard

During its evolution, the keyboard of an organ progressively went from 2 to 5 octaves. Today we consider the 5-octave 61-key keyboard (do 1 to do 6 ) as the generally adopted standard.